
Author, Brett Weintz. Updated 15 June 2021.
Ship vibration analysis involves the response characteristics (amplitude versus frequency) of the vessel structure or system in combination with various excitation(s), e.g. wave encounter, engines, propellers. Understanding structural vibration problems typically involves separately considering these two aspects (response characteristics and excitation sources).
In this Section you can find descriptions of ship structural vibration as well as the various modes of propeller shaft vibration. Includes discussion of vibration characteristics and conditions that may lead to resonance. A case study is provided.
Ship structural vibration
A steel ship is a flexible structure with large/ global sections of the vessel typically having numerous global vibration natural frequencies under 10 Hz as well as many panel/ bulkhead/ deck areas typically having natural frequencies in the range 20 Hz to 80 Hz. As (steel) structures are generally highly elastic, an apparent heavy vibration may be a forced vibration response to a strong excitation, rather than resonance of a natural frequency with a (not adverse) excitation. Measurements are typically required to confirm characteristics of the structure response as well as the excitation source. Resonance is identified by a 90° phase difference between the excitation and vibration response wave forms.
Investigations of ship structure vibration problems typically involve measurement/ recording signals from accelerometers located in the subject area and adjacent to likely excitation sources as well as machinery phasor (speed) sensors during a range of operating conditions. Vibration measurements while alongside, or at anchor, when subject to only random ambient excitation, i.e. waves, etc, may also be conducted to find the natural frequencies of the structure. Signals are analyzed for vibration (response) amplitudes and frequency characteristics in order to understand the nature of the vibration. It should be noted that while many vibration (excitation) are mainly harmonic, there is always a random component, e.g. variations in the propeller inflow wake affecting blade pass rate vibration amplitudes. Thus, maximum amplitudes are typically significantly greater than peak values derived by any averaged sinusoidal curve-fit.
If adverse vibrations arise from erroneous operation or equipment condition, then corrective actions can sometimes be identified/ devised. However, corrective action may present a design challenge. With many structural vibration problems it is not possible to alter the excitation source or the transmission path nor is there an opportunity to significantly modify the stiffness/ mass characteristics of the structure exhibiting a response. In such cases the remedial options may be limited to palliative measures to reduce the effects on crew/ passengers and/ or strategies to avoid particular problem speeds or operating conditions.
With regards analysis, it should be noted that vibration peak amplitudes, of the overall signal or discrete frequencies/ bands, are best derived from the time domain data, e.g. by application of numeric narrowband filters, etc. The fast Fourier transform (fft) accurately calculates rms (root mean square) line amplitudes, as is fundamental to the algorithm, however, the ratio of peak to rms for any signal is generally greater than √2 (except for an isolated sinusoid), making derived peak amplitudes inaccurate. Any window function applied to the signal subject to fft will also result in lower than actual rms amplitudes.
Ship vibration excitation sources
Main engines and propellers typically have the greatest power output on board a vessel, thus they are often found to be the main source(s) of vibration energy. Vibration excitation sources may include:
- Main engine and/ or generator sets. Firing rate tends to be the strongest vibration. However, engines exhibit vibration in X, Y and Z directions at many harmonics/ rotational orders as generated by inertia reaction forces from the reciprocating masses, e.g. 2x, 4x, 6x, et seq., in addition to other numeric progressions of orders due to the arrangement of cranks (like 3x, 6x, 9x for a six cylinder engine). A common problem can be excitation of a hull global lateral vibration natural frequency by main engine 2x order vibration. Note that each cylinder of a two-stroke engine produces a combustion impulse on every revolution of the (propeller) shaft, i.e. firing_rate (Hz)= cylinders x rpm/60, whereas a four-stroke engine cylinder produces an impulse every second revolution of the shaft, i.e. firing_rate (Hz)= cylinders x rpm/120.
- Main engine and/ or generator set cylinder-to-cylinder firing/ combustion imbalance, i.e. not full misfire, can excite low frequency vibration response. Note misfire frequency for a two-stroke engine is at 1x order, i.e. rpm/60 (Hz), whereas on a four-stroke engine one every two revolutions, i.e. 0.5x order, rpm/120 (Hz).
- Propeller blade pass.
- Propeller cavitation. This typically can manifest as a broadband response of local structure in the propeller aperture to impulses from cavitation bubble implosions. However, circulation around the propeller can cause the cavitation fluid stream to be intersected by the blades resulting in a modulated vibration (apparently harmonic).
- Reduction gearing tooth mesh frequency.
- Propulsion electric motor drive switching frequencies and harmonics (audio frequency range).
- Propeller shaft vibration.
- Wave impact forces and ship motion inertial reactions.
- High power pumps and associated pipework systems.
Propulsion shaft vibration
Regarding shafting, typical design procedures and guidelines/ Classification Society rules generally ensure that significant response/ resonance of lateral or torsional modes do not occur. However, circumstances such as; failures of damping systems, shaft/ coupling damage, unforeseen operating conditions as well as heavy bearing wear, can result in adverse vibratory response of the shaftline. Shaftline vibration is typically measured using non-contact proximity probes and/ or strain gauges with temporary radio telemetry data links.
Shaft lateral vibration
Ship propeller shaft lateral vibration involves beam mode(s) oscillation of the shaft. Resonance can occur if an excitation harmonic coincides with a lateral natural frequency. Vibratory amplitudes depend on the equilibrium between excitation energy and damping. The first lateral (‘propeller’) mode typically involves an anti node (maximum vibratory amplitude) at the propeller and has the lowest natural frequency which may be close to excitation harmonics at high power. A forced response of this mode, rather than resonance, may occur if the sterntube aft bearing is heavily worn (having reduced damping and clearance to permit motion) along with operations producing strong blade rate harmonic excitation on the propeller, e.g. heavy manoeuvring, running astern or blade cavitation due to light draught aft. Similarly, a forced response of higher modes may occur if the stern tube forward bearing, or aft intermediate if stern tube forward not fitted, is lightly loaded/ unloaded, or heavily worn with possible associated consequential bearing damage.
Should the propulsion shafting, or the ship transom area, show a progressive increase in vibration intensity over time, e.g. say indicated by seal leakage, then it may be related to wear of shaftline bearings permitting greater amplitude(s) of motion as well as reduced damping. A process of checks and inspections of bearings (and couplings) should be conducted where such conditions are suspected.
Accurate predictions of shaftline lateral vibration natural frequencies by calculation can be challenging due to difficulties in calculating the lateral stiffness at each bearing support. This involves a combination of the lubricant film, supporting structure and bearing wall (as springs in series). With non-metallic bearings, the bearing wall is a significant element of the overall stiffness (and is non-linear versus load). Note that the lubricant film stiffness varies in proportion to load and inversely with clearance (as well as operating conditions via the Sommerfeld number), e.g. see [1]. Thus, a heavily loaded bearing would have a high film stiffness. Conversely, a lightly loaded bearing with an increased clearance would have a low stiffness. The support stiffness differ between the vertical and horizontal directions, thus contributing to the complex Lissajous figure type radial progressions/ orbits typically observed on propeller shafts. Calculations should also account for the added mass of water entrained around the propeller as well as gyroscopic damping (inertia varying with speed) of the propeller disc. Given the uncertainty associated with support stiffness calculations are usually performed using lower and upper bounds of stiffness at each support to thus derive a range of natural frequencies for each vibration mode.
[1. Lund J., Thomsen K., ‘A calculation method and data for the dynamic coefficients of oil-lubricated journal bearings’, 1978.]
Lateral vibration can be confirmed by dynamic measurement of radial displacement in vertical and horizontal directions using non-contact proximity sensors as well as shaft bending using strain gauges and radio telemetry equipment. Note that trials measurements should be conducted under all operating conditions that could result in problem vibration, e.g. damping may limit any lateral vibration response during all motoring ahead cases, but astern running may generate significant excitation and response.
It should be noted that as lateral vibration of a shaft tends to be stationary with the ‘ground’ reference axes, i.e. non rotating. Vibration signals from sensors mounted in the ‘ground’ plane contain the (true) shaft/ beam response frequencies. However, vibration signals from sensors mounted on the rotating shaft, e.g. strain gauges, exhibit a shift by ±1x rotation rate of all response frequencies due to the relative rotation of the sensor versus the (stationary) vibration. This provides confirmation/ identification of lateral vibration. See vibration characteristics/ analysis supplement below for further discussion.
Do you suspect a shafting or structural vibration problem?
An important part of any investigation process is to untangle vibration sources/ causes from response/ effect.
Brabon Engineering Services will make a thorough investigation and help solve your problem.
Call for a discussion: +353 87 383 5043
email for a proposal: info@brabon.org
Send a message via our contact page
Connect on LinkedIn
Shaft torsional vibration
Ship propeller shaft torsional vibration resonance can occur if an excitation harmonic coincides with a torsional mode natural frequency during normal operation. Damage may occur if the condition is allowed to continue for a significant period. Torsional vibration of diesel engine prime mover propulsion systems tend to mainly be excited at the engine firing rate tends to be the main excitation of torsional vibration.
Response amplitudes depend on excitation level, system inertia/ stiffness, i.e. frequency characteristics, as well as total damping. While analysis techniques and design guidance are available, torsional vibrations and associated damage may result from various conditions, either individually or as combinations. Example scenarios include the following:
- An abnormal condition producing adverse vibration (with the combination of condition and operating mode possibly being unforeseen). For example, a diesel engine may develop a firing imbalance between the cylinders at say idling speed (engines are typically tuned at the service load/ speed by monitoring exhaust gas temperature at each cylinder) generating a significant 1x (two-stroke) or 0.5x (four-stroke) order excitation (cylinder misfire condition) possibly resulting in adverse torsional vibrations (at other than the service speed).
- A normal operation resulting in unforeseen adverse vibrations. For example, two-stroke diesel direct drive propulsion systems typically have a resonance of the one-node mode within the range of normal operating speeds which usually requires a corresponding barred speed range. If the engine speed transits the barred speed range too slowly, due to either (manual) procedures or the control system ramp rate, then the shaftline elements may accumulate significant cycles of elevated torsional shear strain/ stress. This may increase the risk of a fatigue failure over the vessel life. Turbo machinery can similarly suffer problems due to elevated amplitudes of torsional and/ or lateral vibration problems if run-up acceleration is low.
- Deterioration of shaftline components involved in controlling/ limiting torsional vibration, e.g. elastic couplings or torsional vibration dampers. Rubber couplings should be checked periodically for cracking/ heat damage and oil filled dampers require an adequate oil supply at a pressure greater than the coupling manufacturer’s recommended minimum limit.
- Vibration mode not identified during system design. Shaftline systems having multiple ‘branches’, e.g. propulsion system with two diesel engines driving through a combining reduction gearing set, have torsional vibration modes for each combination of branches, e.g. the previous example would have modes (predominantly) involving one engine plus the shaftline as well as both engines (without the shaftline). Calculations of (undamped) natural frequencies during design stage should capture all modes, e.g. say by eigenvalue solution from mass/ stiffness matrices rather than the Holzer method. Where a shafting system includes a reduction gearing set interposed between branches, then the modelled mass inertia and stiffness of elements in the high-speed sections need to be scaled by ratio^2 (model referenced to the low-speed section). Note that the derived frequencies need no correction.
- Malfunction/ deterioration in operation of control equipment. For example, clutch control (engagement/ disengagement) possibly causing shock load/ ‘hang-in’ problems or generator auto-synchroniser (breaker closure when not in-phase) causing heavy transient torque (rather than a torsional vibration) and possibly resulting in consequential coupling damage.
In general, elevated torsional vibrations do not exhibit outward indications, unless or until damage occurs. That is, torsional vibration usually only involves the shaftline system elements with no participation of the surrounding (non rotating) components or structure. Notwithstanding, it is possible for an engine assembly to vibrate as a rigid body on the mounts/ seatings about the crankshaft axis in response to torsional/ running gear force(s) excitations, i.e. for the mass and support stiffness of the engine to participate in shaft torsional vibration. Similarly, in a geared reduction drive the engine-gearing mass and support stiffness may participate in shaft torsional vibration due to the gearing torque reaction.
It should be noted that an engine crankshaft crank throw shape results in (weak) coupling of torsional and axial vibrations. That is, forces/ reactions in the connecting rod generate both torque and axial forces. See vibration characteristics/ analysis supplement below for further discussion.
It should also be noted that vibration signals from sensors mounted on the rotating shaft, e.g. strain gauges, record the (true) shaft response frequencies due to the torsional vibration rotating with the shaft.
Ship structural vibration case study
Vessel
The case involved a VLCC tanker having a single screw, two-stroke diesel, direct drive propulsion system. The main engine had six cylinders and a maximum continuous rating of about 29 MW at 76 rpm. The vessel was fitted with a four blade fixed-pitch propeller. The ship’s crew had reported high levels of vibration on the bridge and bridge wings in particular at shaft speeds above about 67 rpm.
The superstructure upper three decks had a footprint of about 15m longitudinally by 13m athwartships. The bridge wings had a minimum width of 2.7m in the longitudinal direction and extended 23m athwartships from the Bridge house (the outboard ends being level with the ship’s side). Each bridge wing was supported by an angled bracing of about the same longitudinal width extending from the superstructure three decks below to about 5m from the outboard end of the bridge wing.
Vibration measurements
Vibration was measured using accelerometers in three axes on the main engine entablature top, engine room structure supporting the main engine transverse struts, on the tiller flat at the transom (for propeller blade rate excitation), the Bridge deck at the centreline as well as the port and starboard bridge wing ends. An optical sensor was used to measure the propulsion shaft rotation rate. All of the sensors were connected to a computer controlled data logging system for synchronised recording of the data. Trials involving a progressive stepped run-up in shaft speed were conducted in the ballast and laden conditions.
Measurement results, vibration amplitude
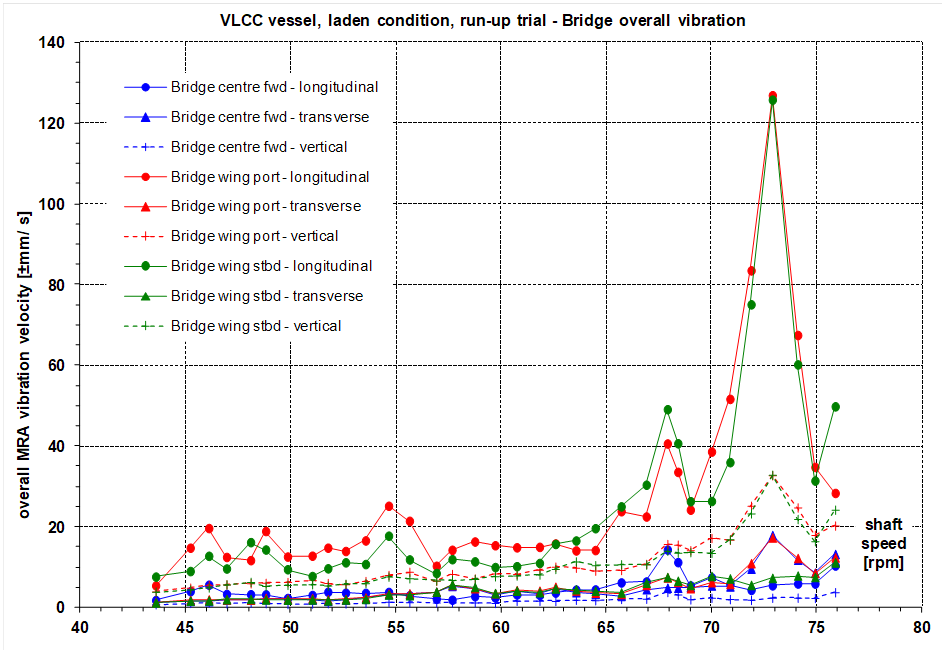
Overall vibration (see note 1) on the bridge wings for the laden condition in the longitudinal direction had peak levels of port side ±126 mm/s and starboard side ±126 mm/s (single amplitude) at 72.9 rpm, Figure 1. In the ballast condition overall vibration on the bridge wings in the longitudinal direction had peak levels of port side ±77 mm/s and starboard side ±119 mm/s at 72.5 rpm. Peak vibration on the bridge wings was high. For reference, ISO 6954:1984 [1] states a level of ±9 mm/s for any single frequency peak in the range 5 Hz to 100 Hz above which adverse comments are likely. Note that ISO6954:2000 [2] specifies assessment using the overall rms value, rather than the peak at any frequency. Assessment of the vibration level using either of these standards would be purely academic.
1: ISO 6954:1984, Guide for overall evaluation of vibration in merchant ships.
2: ISO 6954:2000, Mechanical vibration – guidelines for the measurement, reporting and evaluation of ship vibration with regard to habitability on passenger and merchant ships.
Note that both of these standards have been revised by the following.
ISO 20283-5:2016, Mechanical vibration – Measurement of vibration on ships – Part 5: Guidelines for measurement, evaluation and reporting of ship vibration with regard to habitability on passenger and merchant ships.
Note 1: Overall maximum repetitive amplitude (MRA), as described in ISO4867:1984, Code for the measurement and reporting of ship vibration data (revised by ISO20283-2:2008), was derived statistically from the time domain vibration signal using a histogram of maxima and minima with the greatest 1% of the maxima and minima being discarded to eliminate possible undue effects of any spurious data points.
At the bridge centreline overall vibration in the longitudinal direction had peak levels of ±14 mm/s at 67.9 rpm and ±12 mm/s 69.7 rpm for the laden, Figure 1, and ballast conditions respectively. At the bridge centreline overall vibration in the transverse direction had peak levels of ±18 mm/s at 72.9 rpm and ±14 mm/s at 72.5 rpm for the laden and ballast conditions respectively. Given the speeds at which the peaks occurred, the transverse direction was likely coupled to the motion of the bridge wings.
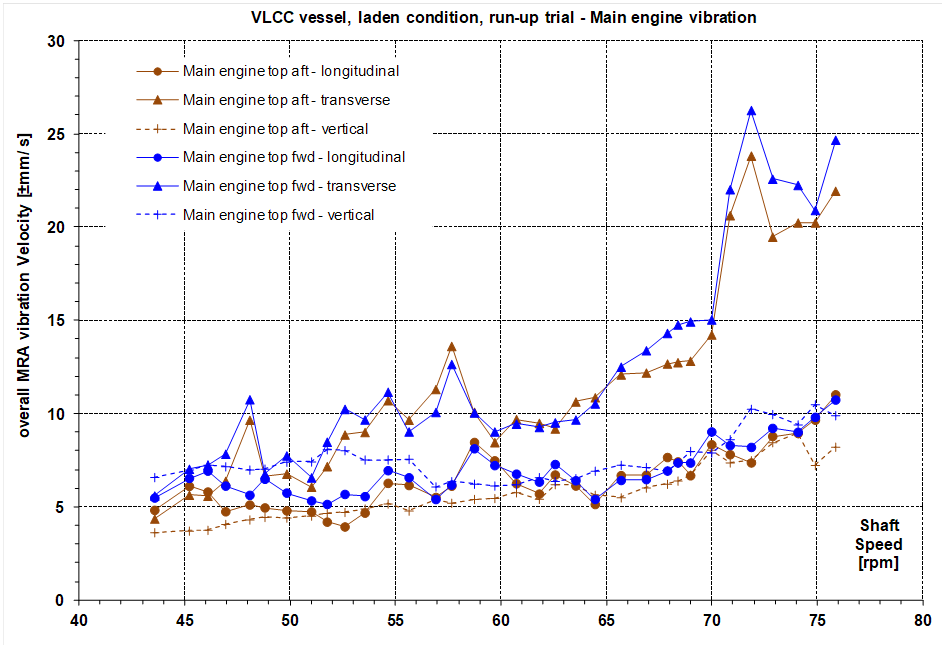
On the main engine entablature forward end for the laden condition (having greater power output than for ballast) overall vibration in the vertical, transverse and longitudinal directions had peak levels of ±11 mm/s, ±26 mm/s and ±11 mm/s respectively, Figure 2. The transverse direction peak occurred at 71.9 rpm, suggesting the curve is a characteristic of the engine and its local supporting structure. The levels are generally typical for a large two-stroke engine.
Measurement results, vibration spectra
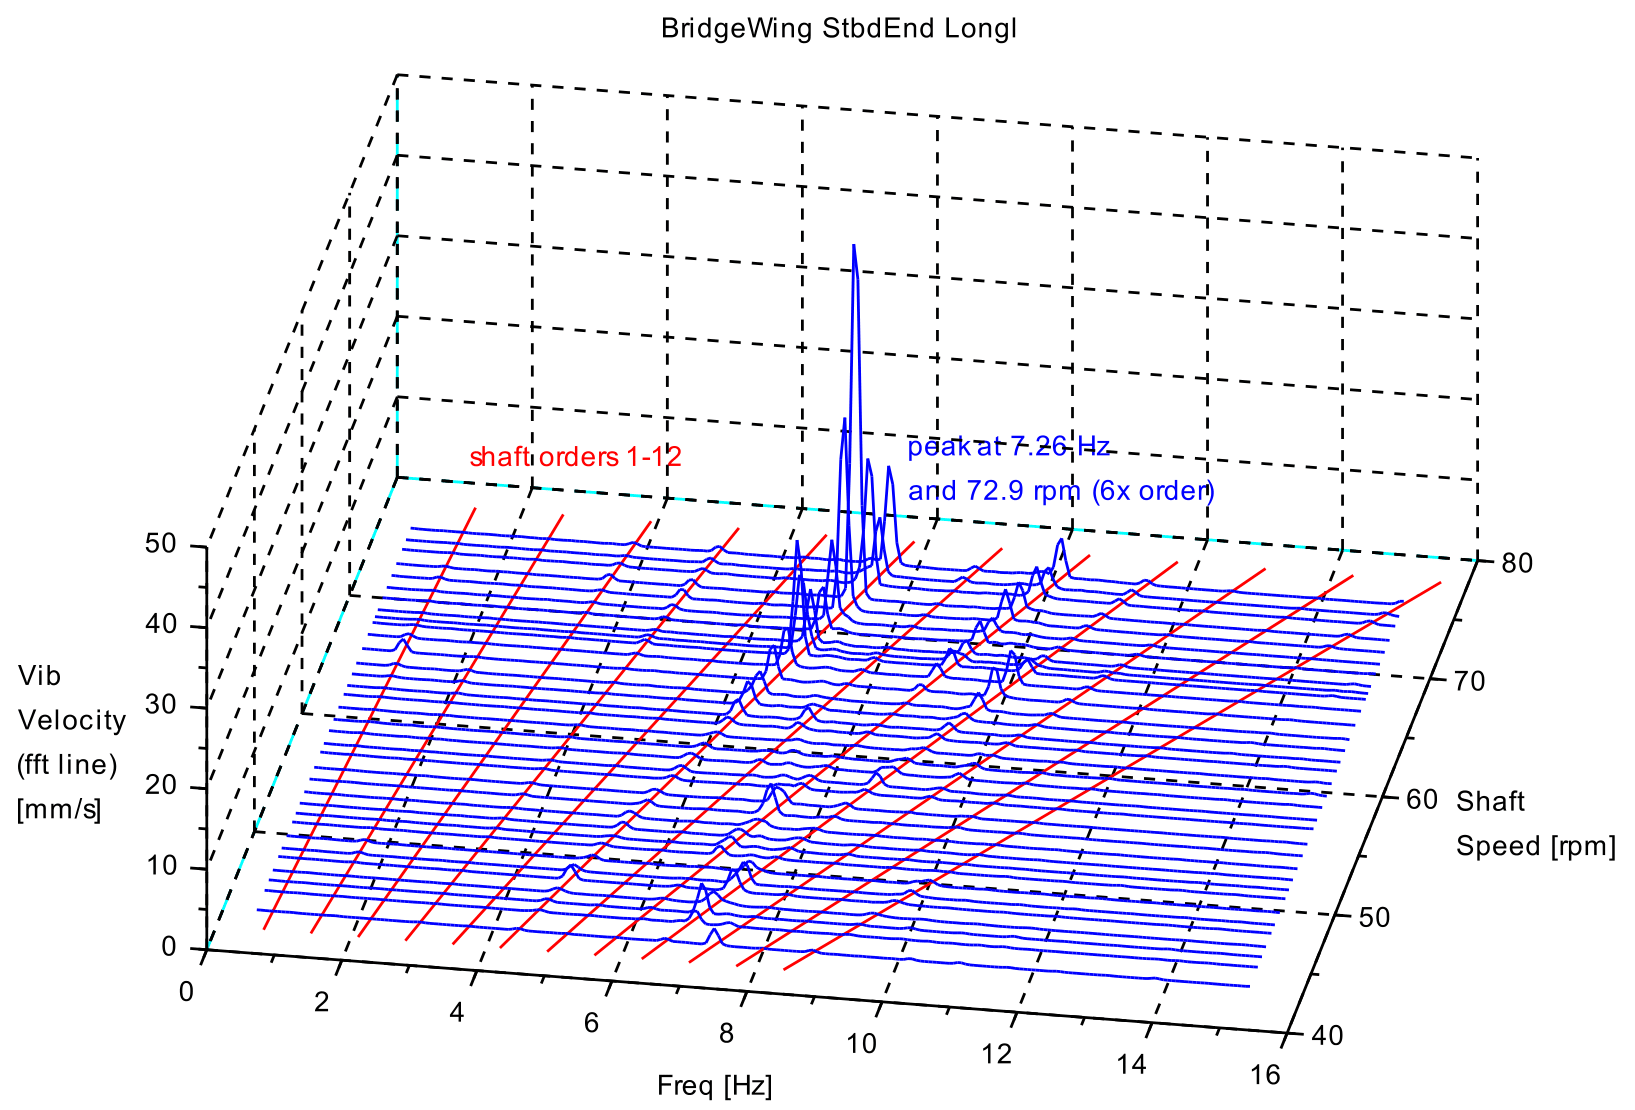
In the laden condition, spectra of longitudinal direction vibration on the port and starboard bridge wings both showed strong peaks at 7.26 Hz in response to the shaft 6x order (engine firing rate) at 72.9 rpm. Waterfall plots of port and starboard bridge wing velocity spectra for each speed in the run-up are shown in Figure 3 and Figure 4 respectively. Response peaks to higher orders of engine excitation at lower speeds suggest this is a natural frequency. In the ballast condition the bridge wing vibration was characteristically similar with frequency peaks at 7.26 Hz in response to the shaft 6x order at 72.5 rpm. The port and starboard bridge wing longitudinal vibration signals at 72.5 rpm showed an out-of-phase motion of the two bridge wings about a vertical axis through the centre of the deck house.
In the laden condition, spectra of longitudinal direction vibration at the bridge deck centreline showed a peak at 6.78 Hz in response to the shaft 6x order (engine firing rate) at 67.9 rpm, Figure 5. Spectra of longitudinal direction on both bridge wings also showed similar peaks at this frequency. In the ballast condition the bridge deck centreline vibration was characteristically similar with a slight shift in frequency peak to 6.90 Hz in response to the shaft 6x order at 69.1 rpm. The bridge deck as well as the port and starboard bridge wing longitudinal vibration signals showed in-phase fore and aft motion of the bridge.
In the laden condition, spectra of vibration at the main engine entablature top (aft and forward) in the transverse direction showed peaks at the 6x shaft order (firing rate) as follows; 4.82 Hz at 48.1 rpm, 5.80 Hz at 57.7 rpm and above 70 rpm and 7.0 Hz, Figure 6. Vibration at lesser amplitudes also occurred at all other integer shaft orders as well as in the longitudinal and vertical directions. The engine showed similar vibratory characteristics for the ballast condition. Inspection of vibration signals at 72.5 rpm showed a phase difference of about 90° between the main engine transverse direction motion and the port/ starboard bridge wings longitudinal motion (being 180° out of phase to each other), indicating a resonance condition.


Conclusions
Measurements showed high levels of longitudinal direction vibration of the port and starboard bridge wings due to resonance with the main engine 6x order firing rate at a frequency of 7.26 Hz between 72.5 rpm and 72.9 rpm. The bridge wings were not supported at the ends, such as shown in Figure 7. Modifications to fit supports/ restraints at the bridge wing ends, such as in Figure 8, could increase the structural natural frequency to higher than the engine firing rate at the normal service speed.


Vibration characteristics/ analysis supplement
Lateral vibration of rotating shafts
Lateral vibration of a rotating shaft tends to be stationary with a plane of the ‘ground’ reference axes, i.e. non rotating. This is a Coriolis effect phenomenon. Thus, vibration signals from sensors mounted on the rotating shaft, e.g. strain gauges, exhibit a shift by ±1x rotation rate of all response frequencies due to the relative rotation of the sensor versus the (stationary) vibration. This provides confirmation/ identification of lateral vibration.
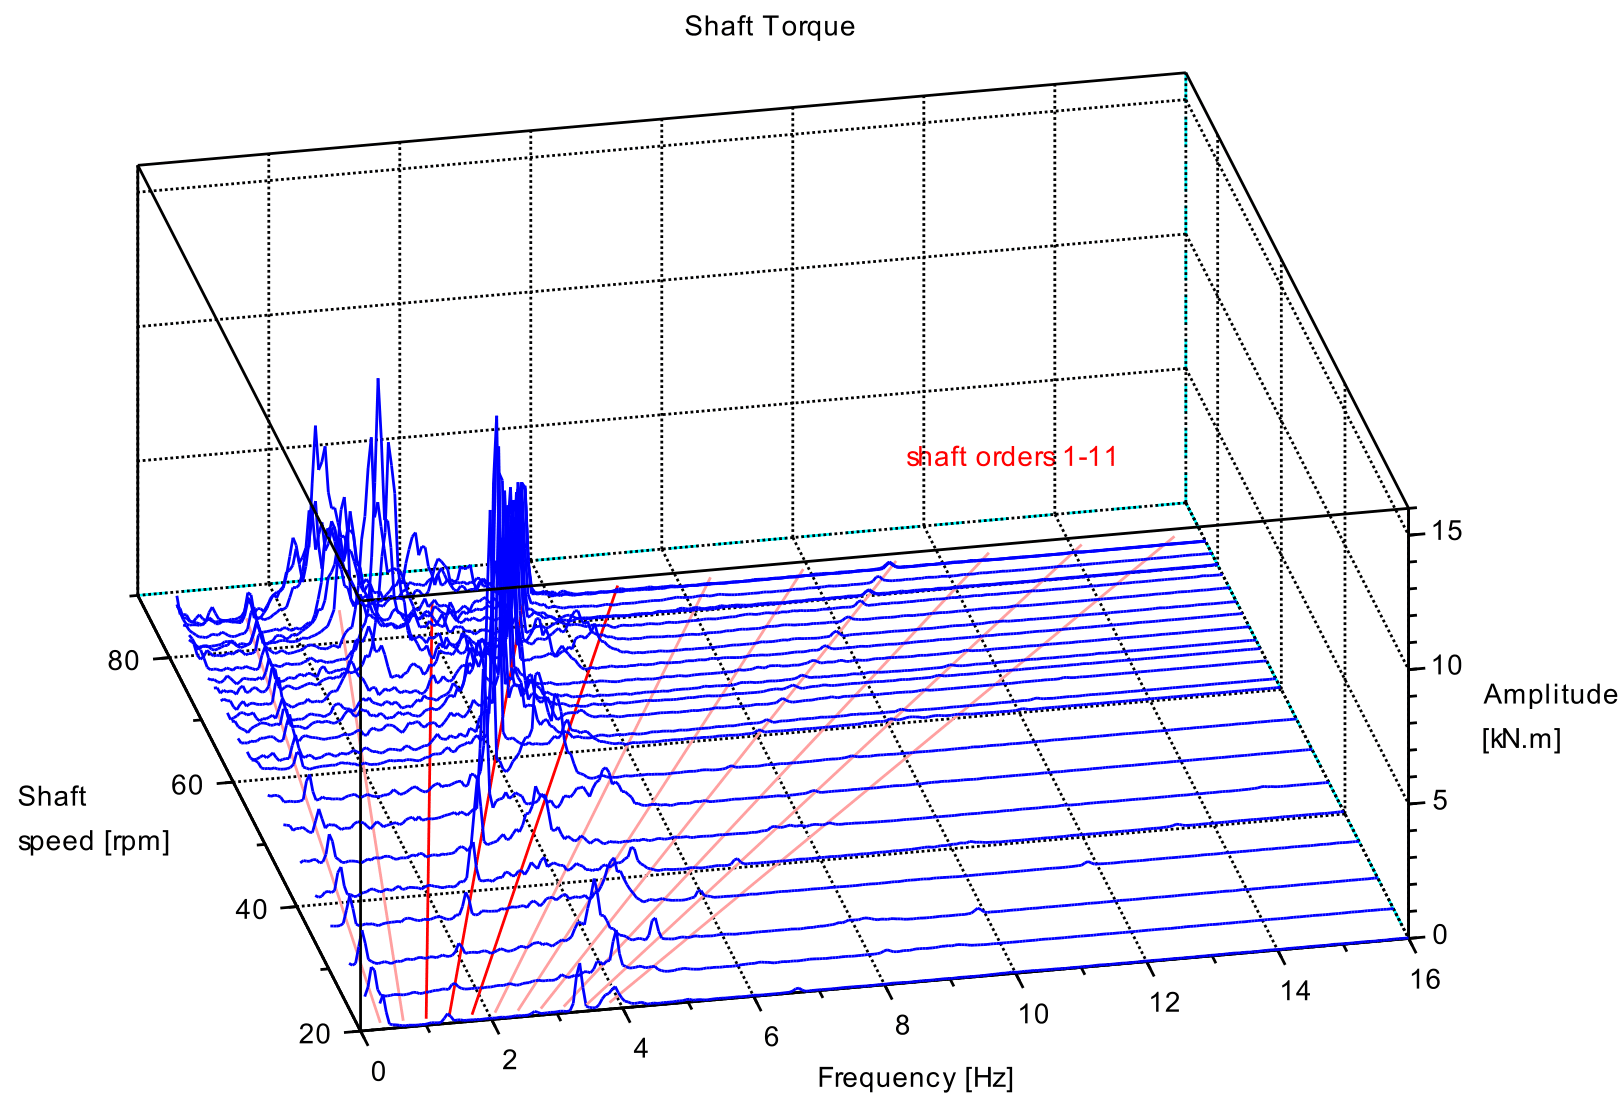
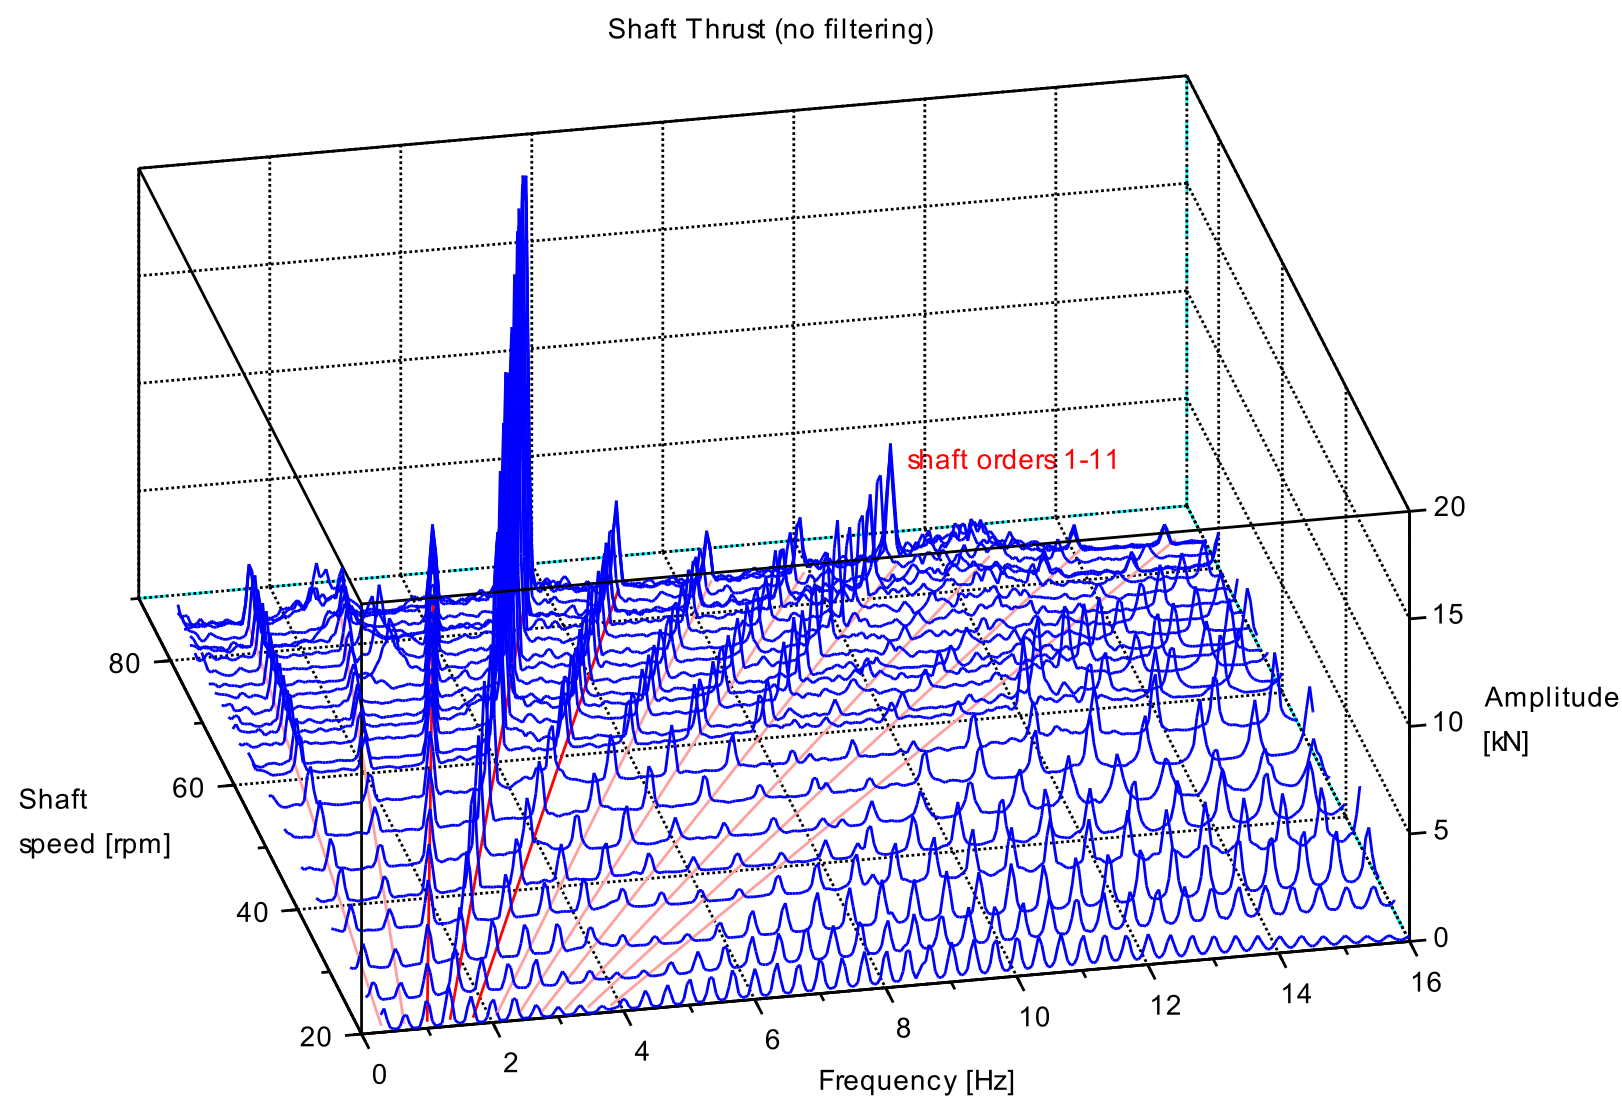
The plots below illustrate the frequency shift. Vibration spectra waterfall plots show shaft vibration on a diesel electric propulsion system comprising direct drive electric motor with mcr of 10 MW at 85 rpm, shafting and four blade propeller. Lateral (bending), torsional (torque shear), thrust were measured using strain gauges connected to telemetry and data logging system. Axial displacement was measured at a shaft flange using a non-contact sensor connected to the data logging system.
The bending strain spectra record vibration at the 3x and 5x orders rather than the 4x order, Figure 9. The torsional vibration spectra show excitation at the 4x order, confirming that a torsional vibration rotates with the shaft, Figure 10. in addition, vibratory thrust and shaft axial displacement show excitation at the 4x order, confirming that axial vibration also rotates with the shaft, Figure 11 and Figure 12.
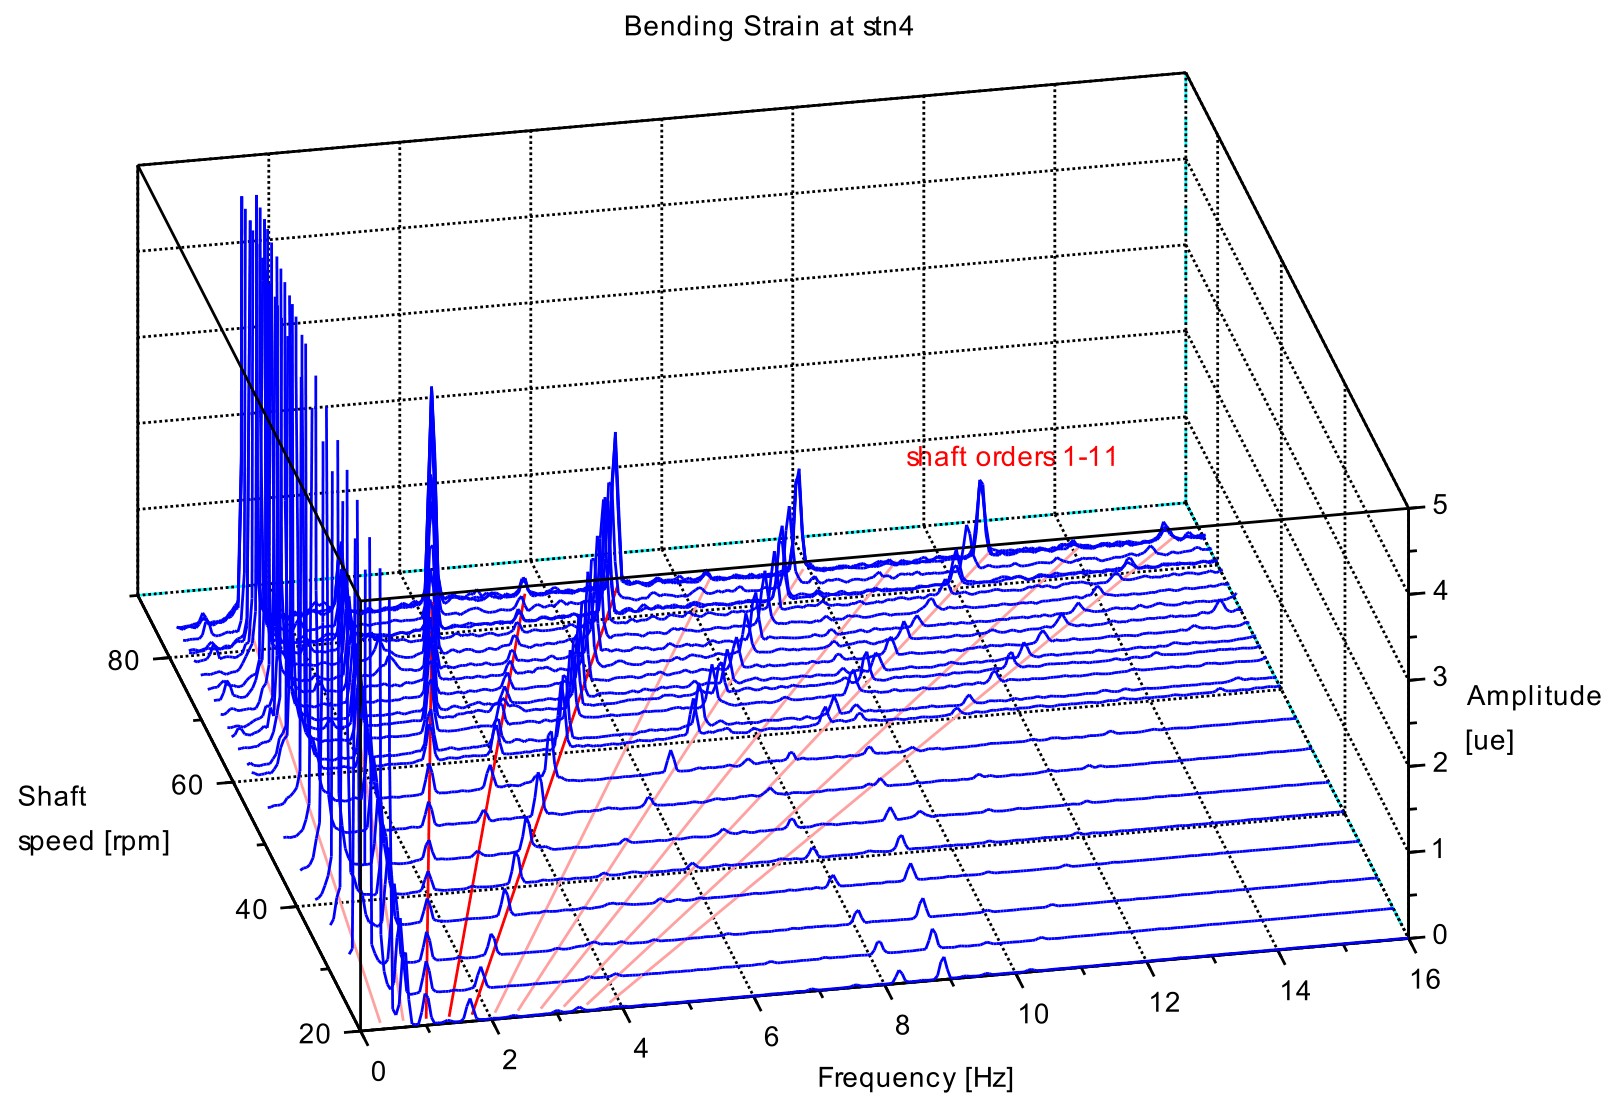
Note also lateral vibration natural frequencies (forward and counter) between 7 Hz and 10 Hz.

Coupling of shaft torsional and axial vibration modes
An engine crankshaft crank throw shape inherently results in weak coupling of torsional and axial vibrations, i.e. transmission between respective modes. That is, forces/ reactions in the connecting rod generate both torque and axial forces. The coupling is weak, thus torsional inertia/ stiffness do not affect axial natural frequencies, and vice versa, i.e. separate systems/ modes for the purpose of modelling calculations.
The plots below illustrate the coupling effect. Vibration spectra waterfall plots show shaft vibration on a direct drive diesel propulsion system comprising two-stroke, nine cylinder engine with mcr of 10 MW at 146 rpm, shafting and four blade propeller. Torsional (torque shear) and thrust were measured using strain gauges connected to telemetry and data logging system. Axial displacement was measured at the engine output flange using a non-contact sensor connected to the data logging system.
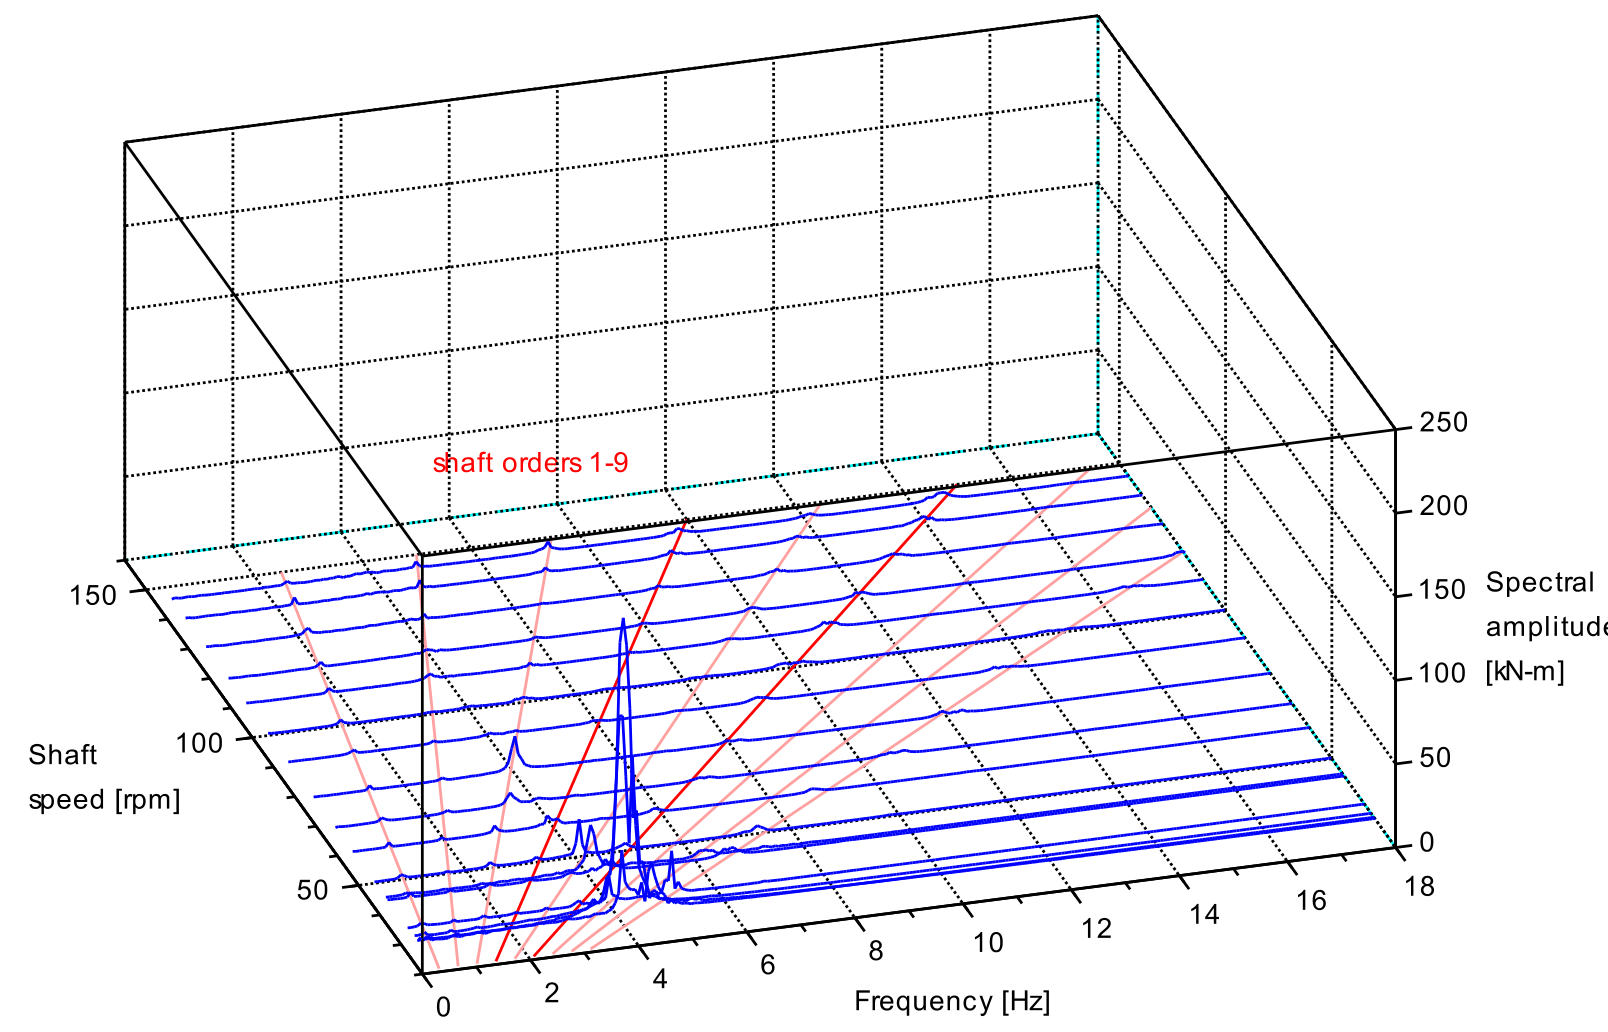
Torsional peak at about 4 Hz most likely the one-node response to the 9x order firing rate excitation at 29 rpm.

Peaks at 10 Hz and 14.6 Hz at 146 rpm, as 4x and 6x excitations respectively, also showed small corresponding peaks in the shaft axial displacement spectra. However, the peaks did not manifest in the torsional spectra. This may be due to a low converse sensitivity.
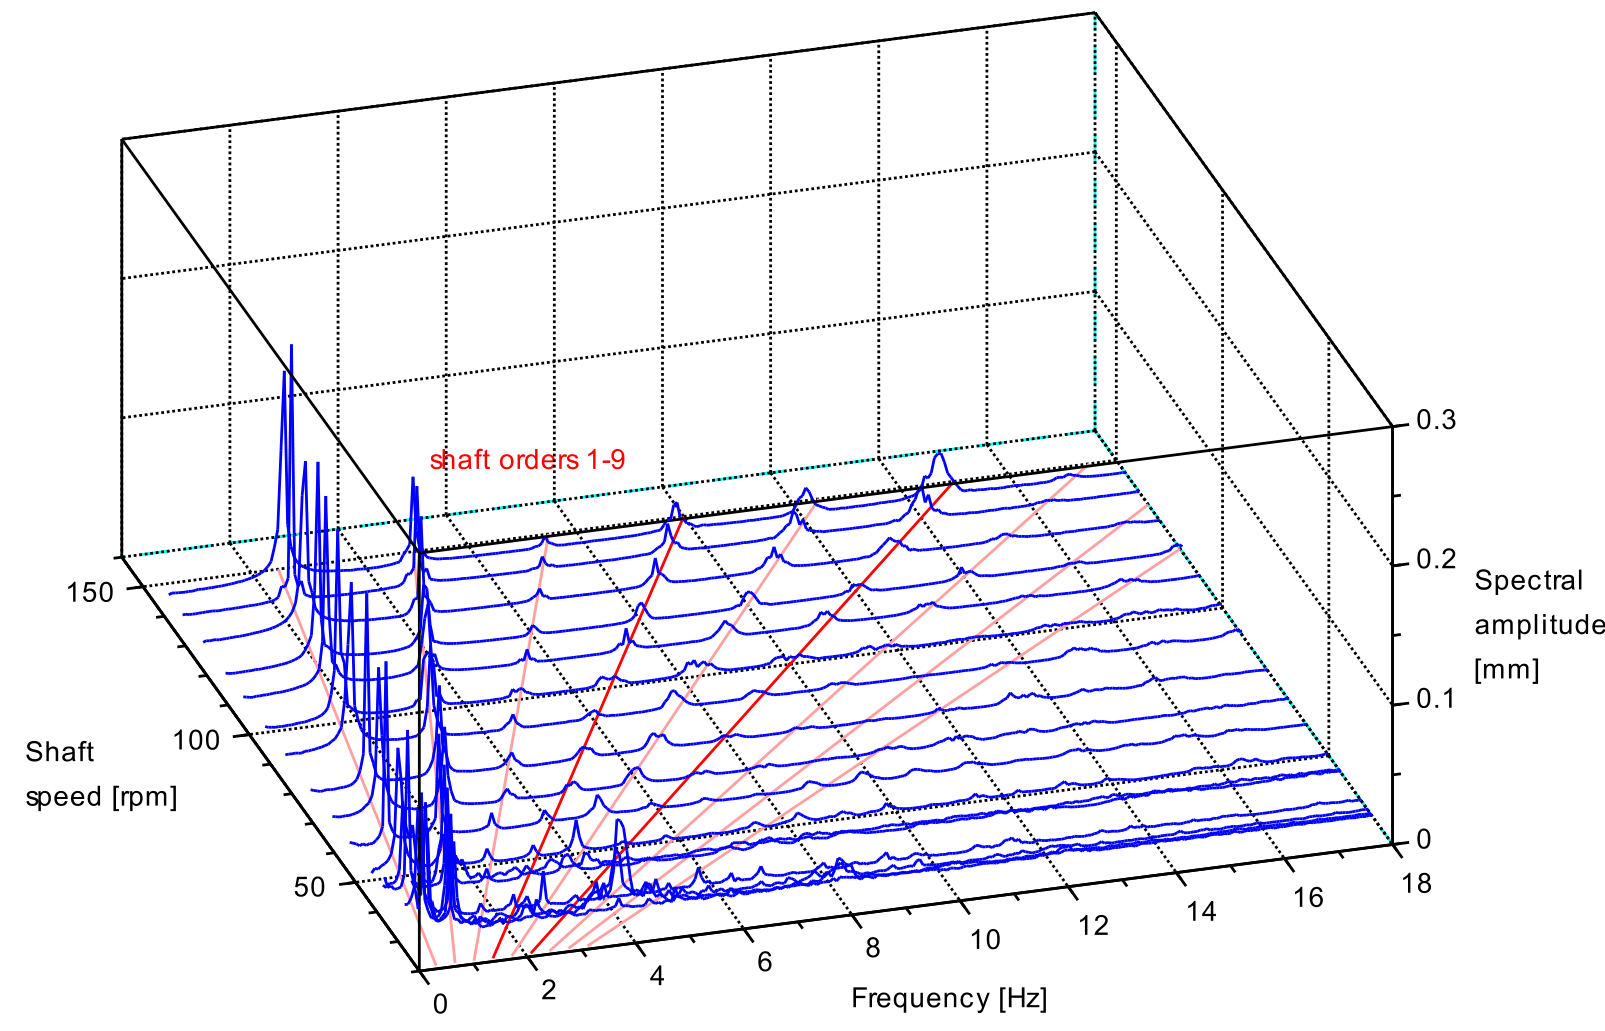
The axial displacement peaks at 1x and 2x orders are likely to be run-out and/ or an effect of the crankshaft asymmetry, rather than shaft dynamics.
Further information
A (separate) case study of Machinery Vibration and Noise Problems is also available.
Please also see the following Brabon Engineering Services pages:
- Shaft alignment principles.
- Root cause analysis of mechanical machinery failures.
~..~

The above notes are applicable to typical generic events, however, please note that every actual event is unique and requires individual consideration. Any action taken upon the information on this website is strictly at your own risk. Brabon Engineering Services are not responsible in any way whatsoever for your use of the information.